Bracknell Forest is one of 6 unitary authority areas within Berkshire in Southern England. It covers 2 towns, Bracknell Forest and Sandhurst, the village of Crowthorne and includes the areas of North Ascot, Warfield and Winkfield. The borough is served by the Bracknell Forest and Wokingham Local Policing Area.
The mid-2022 census estimates that Bracknell Forest population equals 126,881. This is higher than the 2021 census figure of 124,607. As of 2021, Bracknell Forest was the 25th most densely populated of the South East's 64 local authority areas, with around 8 people living on each football pitch-sized area of land. Census data revealed that, in the 10 years between 2011 and 2021, Bracknell’s population increased by 10.1% which is higher than both the South East (7.5%) and England as a whole (6.6%).
Explore a breakdown of population on the Berkshire Observatory
Bracknell Forest is a great place for children and their families to live and work. The local authority and partners have high aspirations for all its residents.
There are strong connections between high-level strategic objectives to raise aspirations for all children and families, the creation of new jobs and the development of exciting education and training resources fit for the 21st century. Despite the current economic situation, regeneration in the area continues and demonstrates the ambition for the area. Much of it has been facilitated by the local authority.
The local authority continues to work on our special educational needs (SEN) improvement plan (Written Statement of Action - WSOA) in co-production with our parents and partners. The last children’s services Ofsted inspection in June 2022 graded the provision as outstanding overall and praised the local authority’s strong partnership approach.
Relative low income for Bracknell Forest
Note: Relative income is defined as a family in low income before housing costs (BHC) in the reference year. A family must have claimed one or more of Universal Credit, Tax Credits or Housing Benefit at any point in the year to be classed as low income in these statistics. for them.
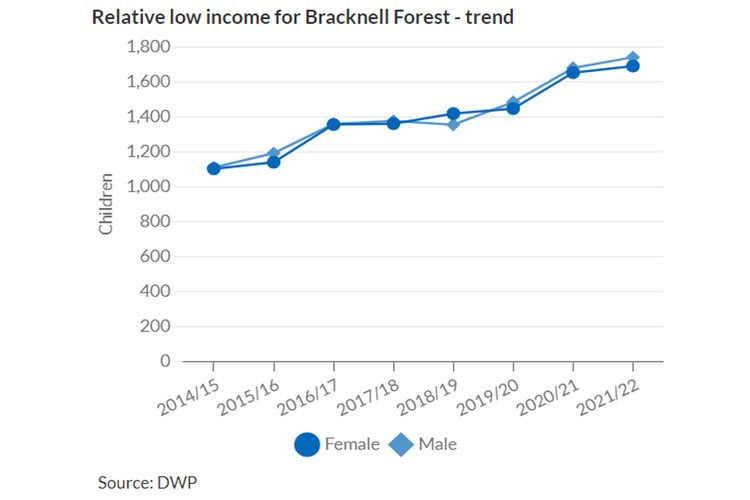
Source: Children and Young People - Berkshire Observatory
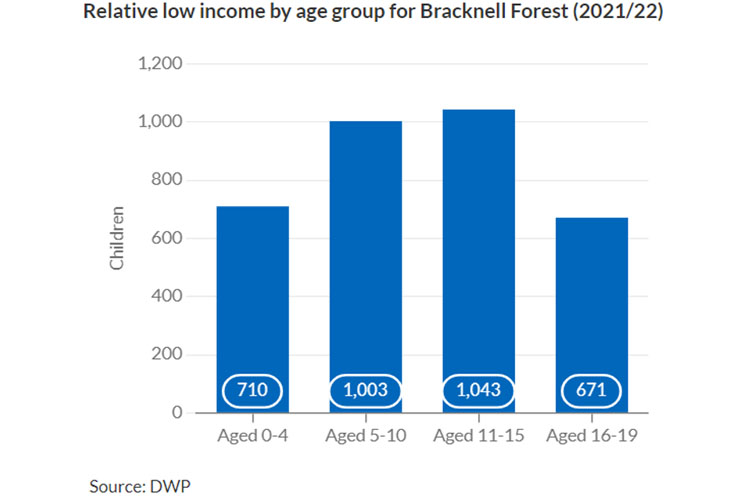
Source: Children and Young People - Berkshire Observatory
| Age group | Number of children |
|---|---|
| Aged 0 - 4 | 710 |
| Aged 5 - 10 | 1,003 |
| Aged 11 - 15 | 1,043 |
| Aged 16 - 19 | 671 |
Pupils getting SEN support
Note: Children have special educational (SEN) needs if they have a learning difficulty which calls for special educational provision to be made for them.
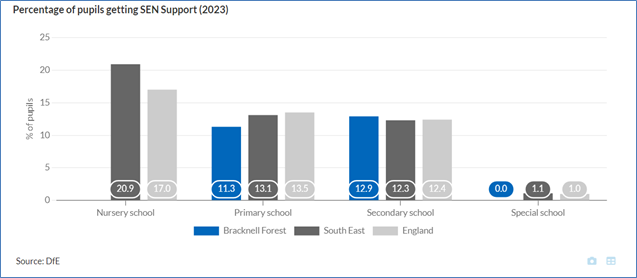
Source: Children and Young People - Berkshire Observatory
| Name | Nursery school | Primary school | Secondary school | Special school |
|---|---|---|---|---|
| Bracknell Forest | 11.3 | 12.9 | 0 | |
| South East | 20.9 | 13.1 | 12.3 | 1.1 |
| England | 17 | 13.5 | 12.4 | 1 |
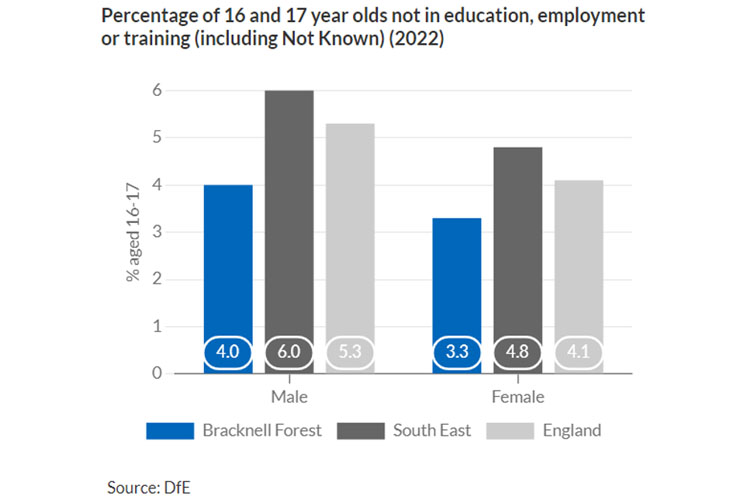
Not in Education, Employment or Training
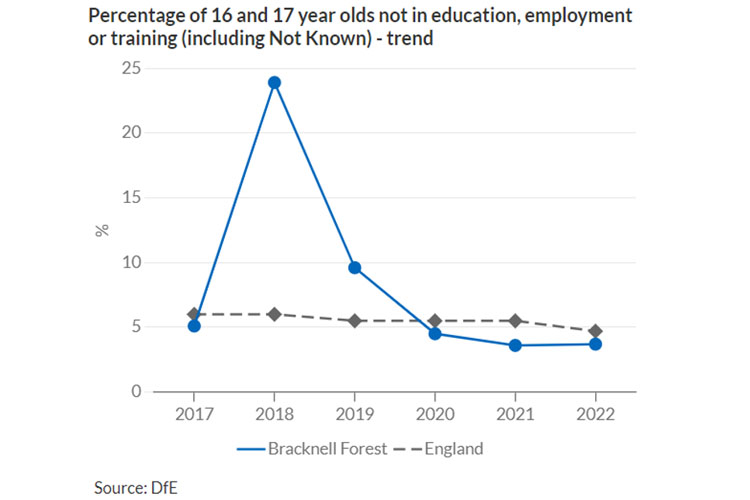
Source: Children and Young People - Berkshire Observatory
Source: Children and Young People - Berkshire Observatory
| Name | Male | Female |
|---|---|---|
| Bracknell Forest | 4 | 3.3 |
| South East | 6 | 4.8 |
| England | 5.3 | 4.1 |
Further data
Further data on vulnerable children in Bracknell Forest is shown below:
- numbers of Children Looked After remains stable in Bracknell Forest
- children aged 10 to 15 made up 40% of all children with a Child Protection Plan (CPP) in 2022 to 2023
- an increased number of children are discussed at the Missing and Child Exploitation (MACE) operational group - however, identified forms of exploitation have decreased over the last 2 years
- post-COVID 19, children requiring CPPs increased to 64.2 per 10,000
- 34% of children with a Child in Need (CIN) Plan had an Education, Health and Care Plan (EHCP) or disability
- 22% of children subject to a CPP had an EHCP or disability
- 10.7% of under 16s live in relatively low-income families - this is over 2,799 children and continues to increase
- the number of CPPs has returned to a more stable level with a rate of 40.2 per 10,000 as at September 2023
- the rate of children with a CIN plan remains higher than average compared to statistical neighbours
- there is an increasing cross-over between children in vulnerable groups and those in youth justice