The data in this report is for the period April 2024 to March 2025.
Year end position
This year, we focused on continual improvement and staff development. This effort took place within the service and across the entire organisation. We conducted the first Information Governance Survey to set a benchmark. This benchmark will help us track our progress in future years.
Key positives
- 90% of staff felt confident about understanding and reporting data breaches should they arise - we found that staff:
- were aware of and read the regular communications
- knew who their IG leads were and how to engage with them
- 70% of staff knew where to send personal data requests and in what circumstances they were not business as usual
- 93% of staff knew where to go to get support on information governance and data protection
- 90% of respondents were aware of privacy notices, but around 9% were not aware we published these on the public website as part of our legal requirements
- 52% of staff responded that they could deal with a freedom of information (FOI) or environmental information regulations (EIR) request independently, but 35% were not confident - this has been factored into the planning for 2025 to 2026
Collaboration with local authorities
We maintain close ties with other local authorities. This helps us understand what is unique to each organisation and what experiences and incidents they share. This collaboration has enabled us to:
- identify fake FOI requests and respond accordingly
- work together on best practices and universal audit issues
Information Commissioner's Office decisions on Bracknell Forest Council
The Information Commissioner's Office (ICO) published 3 decisions about Bracknell Forest Council regarding FOI and EIR decisions. Two decisions were not upheld and one decision was partially upheld.
For more details, visit the ICO website.
Areas of activity this year
Our team's work is often iterative, involving incremental changes and improvements. Key activities this year included:
- implementation of sensitivity classification labelling for Microsoft products
- introducing AI compliance monitoring through Purview to give visibility to activity and ensure adherence to the principles of the AI strategy
- development of a new assurance process for the Record of Processing Activity (ROPA)
- introduction of new training approaches following feedback from the Information Governance Survey
- updated video training and guidance on intranet pages for staff to offer more ways to learn and engage with core subjects.
- updated information sharing templates for use within the organisation
- agreement on new One Drive retention policies, further supporting data reduction
- a new publication scheme has been adopted and is under further development
- support to the Cyber Assessment Framework (CAF) get-ready programme for ICT and provided scrutiny on the process
- review, update and publication of 5 major retention schedules
Risks
We have achieved a considerable amount in the last 12 months. But, there are still some identified risks that we need to monitor over the coming year.
Responding to the Data Use and Access Bill
The Data Use and Access Bill will bring changes to existing legislation, particularly around:
- legitimate interests
- allowing secondary processing if it aligns with the original reasons for collection
- automated decision-making
The impact of data growth on climate and compliance
Continued exponential growth of data and adoption of data-hungry technology such as AI. This growth could put us at odds with:
- our climate change commitments
- core data protection principles of data minimisation (Article 5 of UKGDPR)
Increasing prosecutions for data breaches
We have continued to see a national increase in prosecutions for data breaches. These have occurred because staff in affected organisations have access to data they do not need.
To use data for better service insights, we need to clarify access control requirements and compliance monitoring to avoid those risks.
Upcoming changes in cyber resilience
The currently unpublished Cyber Resilience Bill may change how we define national infrastructure. This could include elements from our existing estate and may require:
- additional measures for overview and scrutiny
- increased pressure on resources
By understanding these issues, we can handle the complexities of data growth better. This way, we stay focused on our climate goals and protect our data principles.
Continual improvement
We are committed to continual improvement. With this in mind and based on feedback from the staff survey, we identified the following activities for 2025 to 2026:
- specific worked training examples for areas such as FOI, EIR, Data Protection Impact Assessment (DPIA) and Subject Access Request (SAR) - what does 'good' look like?
- bite-sized training that people can go back to, making access to information easier
- look to create a broader benchmarking approach with other local authorities
- look to create simpler pathways for staff and the public to report issues or concerns through existing technology, including automating non-decision-making processes where appropriate
Security incidents
Personal data breaches
Between April 2024 and the end of March 2025, there were a total number of 120 security incidents recorded through the formal incident process, with a total of 6 reportable breaches to the ICO, down from 9 reported in the previous year.
Of those reported to the ICO, 100% were within the 72-hour timeframe, an improvement on 66% reported for 2023 to 2024.
To date, no reportable incident has led to ICO sanctions, and actions have either been transferred to departments to resolve or have been built into our ongoing improvement plan, where they are cross-cutting.
Incident type by month
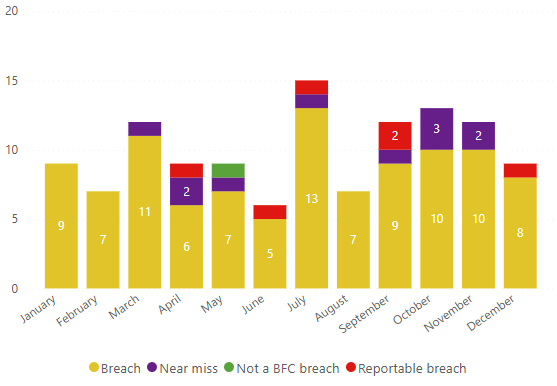
| Month | Breach | Near miss | Not a BFC breach | Reportable breach |
|---|---|---|---|---|
| Jan | 9 | 0 | 0 | 0 |
| Feb | 7 | 0 | 0 | 0 |
| Mar | 11 | 1 | 0 | 0 |
| Apr | 6 | 2 | 0 | 1 |
| May | 7 | 1 | 1 | 0 |
| Jun | 5 | 0 | 0 | 1 |
| Jul | 13 | 1 | 0 | 1 |
| Aug | 7 | 0 | 0 | 0 |
| Sep | 9 | 1 | 0 | 2 |
| Oct | 10 | 3 | 0 | 0 |
| Nov | 10 | 2 | 0 | 0 |
| Dec | 8 | 0 | 0 | 1 |
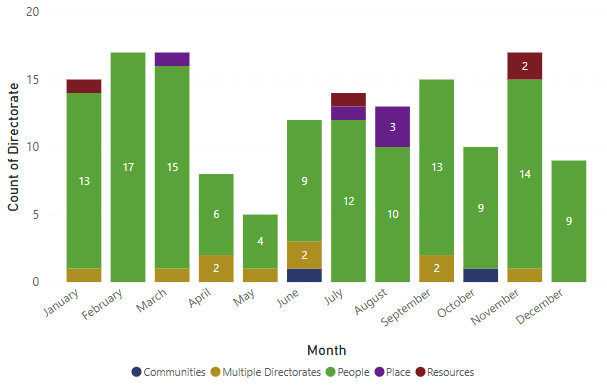
Incidents by directorate by month
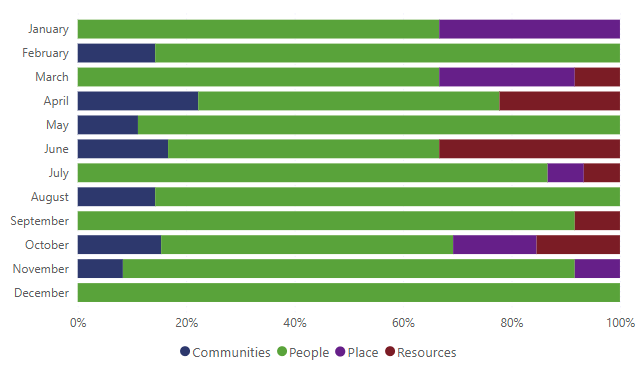
| Month | Communities | People | Place | Resources |
|---|---|---|---|---|
| Jan | 0 | 7 | 3 | 0 |
| Feb | 1 | 6 | 0 | 0 |
| Mar | 0 | 8 | 3 | 1 |
| Apr | 2 | 5 | 0 | 2 |
| May | 1 | 8 | 0 | 0 |
| Jun | 1 | 3 | 0 | 2 |
| Jul | 0 | 13 | 1 | 1 |
| Aug | 1 | 6 | 0 | 0 |
| Sep | 0 | 11 | 0 | 1 |
| Oct | 2 | 7 | 2 | 2 |
| Nov | 1 | 10 | 1 | 0 |
| Dec | 0 | 9 | 0 | 0 |
Breakdown by type of incident
The most significant type of incident occurring within the organisation is data sent to the wrong people. About 4% of these breaches were reportable to the ICO.
This corresponds with the top national trend reported by the ICO for all security incidents, which is 17%.
Nationwide, unauthorised access and phishing incidents have increased for all reportable incidents.
This year, we had one incident with data breaches by our processors. At the time of writing this report, we have not confirmed the data as breached yet due to the nature of the incident. However, we filed a pre-emptive notice with the ICO.
The rise in successful phishing attacks adding malware to ICT environments is of note. We are closely monitoring this activity. We remind staff what suspicious activity looks like and how it changes with generative AI.
Type of incident
| Type of incident | Q1 | Q2 | Q3 | Q4 | Total |
|---|---|---|---|---|---|
| Data emailed to incorrect recipient | 18 | 12 | 24 | 21 | 75 |
| Data posted or faxed to incorrect recipient | 1 | 4 | 1 | 2 | 8 |
| Failure to redact | 1 | 0 | 3 | 1 | 5 |
| Failure to use BCC | 1 | 1 | 0 | 1 | 3 |
| Incorrect form attached to email | 0 | 0 | 0 | 1 | 1 |
| Loss or theft of device containing personal data | 1 | 0 | 2 | 0 | 3 |
| Other | 2 | 5 | 1 | 7 | 15 |
| Unauthorised access (cyber incident) | 0 | 1 | 0 | 0 | 1 |
| Unauthorised access (non-cyber) | 2 | 0 | 0 | 0 | 2 |
| Total | 28 | 24 | 34 | 34 | 120 |
Since 2021, we have worked hard to improve the organisation's understanding of data breaches. We have created a learning culture that encourages staff to report issues as soon as they identify them.
Support from information governance leads has led to more reporting since 2021 and 2022. This growth reached its highest point with breaches recorded in 2022 to 2023. This is expected as areas that were often under reported are now more transparent.
Over the last 2 years, numbers have dropped, but we now notice incidents faster. Staff are also reporting issues earlier.
This shows better awareness and a desire to act within the organisation. This was supported by responses from the information governance survey.
Security incidents by type by directorate
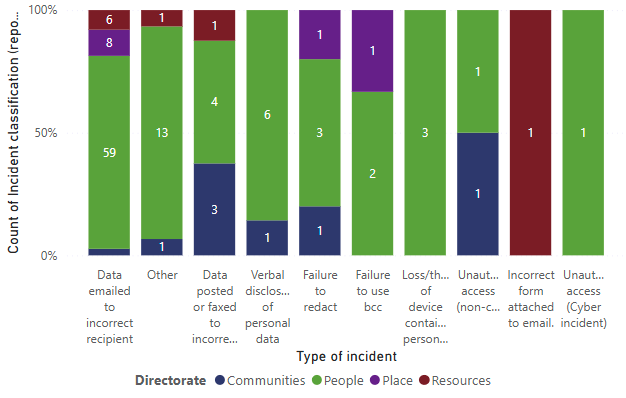
| Type of Incident | Communities | People | Place | Resources |
|---|---|---|---|---|
| Data emailed to incorrect recipient | 2 | 59 | 8 | 6 |
| Other | 1 | 13 | 0 | 1 |
| Data posted or faxed to incorrect person | 1 | 4 | 0 | 1 |
| Verbal disclosure of personal data | 1 | 6 | 0 | 0 |
| Failure to redact | 1 | 3 | 1 | 0 |
| Failure to use bcc | 0 | 2 | 1 | 0 |
| Loss/theft of device containing data | 0 | 3 | 0 | 0 |
| Unauthorized access (non-cyber) | 1 | 1 | 0 | 0 |
| Incorrect form attached to email | 0 | 0 | 0 | 1 |
| Unauthorized access (Cyber incident) | 0 | 0 | 1 | 0 |
Total security incidents year on year
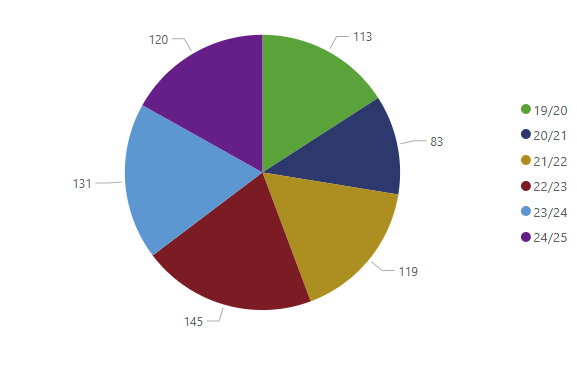
The security incidents year on year chart shows:
- 2019 to 2020 - 113
- 2020 to 2021 - 83
- 2021 to 2022 - 119
- 2022 to 2023 - 145
- 2023 to 2024 - 131
- 2024 to 2025 - 120
Freedom of Information and Environmental Information Regulations
Between April 2024 and the end of March 2025, 1,235 FOIs were received. This is an increase of 8.7% from the previous year.
The average number of days for on-time FOI completions is 12. For late completions, the average is 34 days, which is a slight decrease from last year.
The ICO has published 3 decision notices about the organisation and our responses to FOI and EIR. Two were not upheld, and one was upheld on a technical note, as we had used an incorrect exemption. The principle of the exemption was correct, but we issued a section 41 instead of section 43(2).
Total number of FOI and EIR
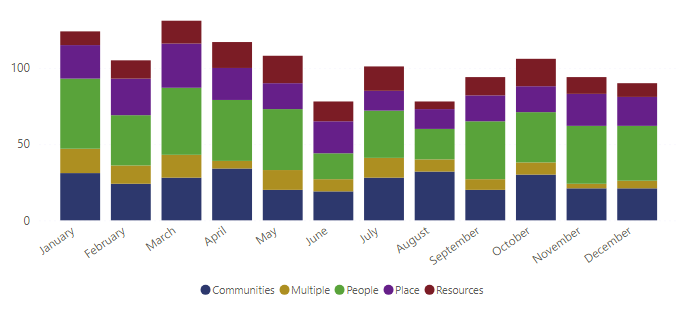
| Month | Communities | Multiple | People | Place | Resources |
|---|---|---|---|---|---|
| January | 31 | 16 | 46 | 22 | 9 |
| February | 24 | 12 | 33 | 24 | 12 |
| March | 28 | 15 | 44 | 29 | 15 |
| April | 34 | 5 | 40 | 21 | 17 |
| May | 20 | 13 | 40 | 17 | 18 |
| June | 19 | 8 | 17 | 21 | 13 |
| July | 28 | 13 | 31 | 13 | 16 |
| August | 32 | 8 | 20 | 13 | 5 |
| September | 20 | 7 | 38 | 17 | 12 |
| October | 30 | 8 | 33 | 17 | 18 |
| November | 21 | 3 | 38 | 21 | 11 |
| December | 21 | 5 | 36 | 19 | 9 |
Total FOI or EIR year on year by directorate
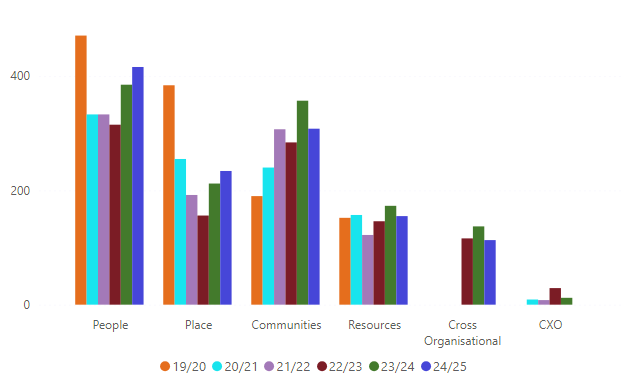
| Directorate | 2019 to 2020 | 2020 to 2021 | 2021 to 2022 | 2022 to 2023 | 2023 to 2024 | 2024 to 2025 |
|---|---|---|---|---|---|---|
| People | 471 | 333 | 333 | 315 | 385 | 416 |
| Place | 384 | 255 | 192 | 156 | 212 | 234 |
| Communities | 190 | 240 | 307 | 284 | 357 | 308 |
| Resources | 152 | 157 | 122 | 146 | 173 | 155 |
| Cross Organisational | 0 | 0 | 0 | 116 | 137 | 113 |
| CXO | 0 | 9 | 8 | 29 | 12 | 0 |
Monthly completion rates
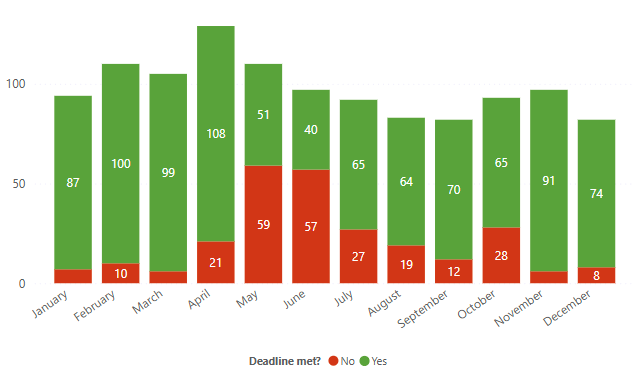
| Month | Statutory deadline met | Statutory deadline not met |
|---|---|---|
| Jan | 87 | 7 |
| Feb | 100 | 10 |
| Mar | 99 | 6 |
| Apr | 108 | 21 |
| May | 51 | 59 |
| Jun | 40 | 57 |
| Jul | 65 | 27 |
| Aug | 64 | 19 |
| Sep | 70 | 12 |
| Oct | 65 | 28 |
| Nov | 91 | 6 |
| Dec | 74 | 8 |
Response times
21% of all responses from the organisation go beyond the statutory 20-day limit. This is an improvement from 23% in the previous reporting year and reflects a downward trend.
Of those late:
- 51% were between 1 and 5 days late
- 30% were between 6 and 14 days late
- the remainder were beyond 15 days
We made significant improvements across the year.
In quarter 4, the response rate was 92.7% within 20 working days. This quarter had the highest number of requests.
The number of internal reviews has decreased from 20 in 2023 to 2024 to 16 in this reporting period.
Exemptions
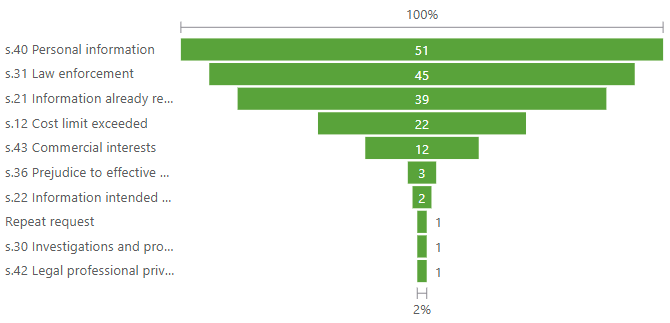
| Reason for exemption | Count |
|---|---|
| s.40 Personal information | 51 |
| s.31 Law enforcement | 45 |
| s.21 Information already reasonably accessible | 39 |
| s.12 Cost limit exceeded | 22 |
| s.43 Commercial interests | 12 |
| s.36 Prejudice to effective conduct of public affairs | 3 |
| s.22 Information intended for future publication | 2 |
| Repeat request | 1 |
| s.30 Investigations and proceedings conducted by public authorities | 1 |
| s.42 Legal professional privilege | 1 |
Average response rates by directorate
| Directorate | No | Yes |
|---|---|---|
| Resources | 23.55 | 13.21 |
| Place | 27.45 | 11.13 |
| Communities | 32.00 | 11.70 |
| Multiple | 31.04 | 12.24 |
| People | 41.48 | 12.21 |
Requests by breakdown
Most requests continue to come from individuals or commercial entities as they have done for the last 5 years.
An EIR can be made in writing or verbally, however FOI requests must be made in writing. We have seen an increase in FOIs being submitted directly through email and not using the online form.
This needs further investigation so we can encourage people to use the form. The form submissions will help us get a clearer understanding of what individuals need.
This will simplify responses and improve automatic classification. In turn, this will help with the disclosure process.
Category source
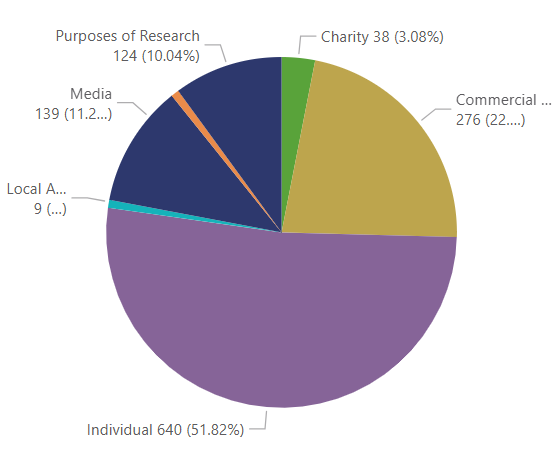
| Category source | Count |
|---|---|
| Individual | 640 |
| Local authority | 9 |
| Media | 139 |
| MP | 9 |
| Purposes of research | 124 |
| Charity | 38 |
| Commercial organisation | 276 |
Category source year on year
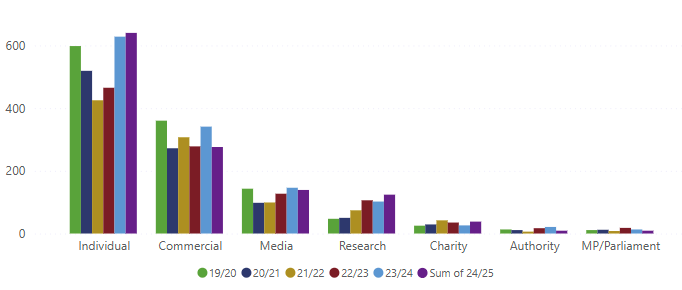
| Requestor Type | 2019 to 2020 | 2020 to 2021 | 2021 to 2022 | 2022 to 2023 | 2023 to 2024 | 2024 to 2025 |
|---|---|---|---|---|---|---|
| Individual | 598 | 519 | 425 | 465 | 628 | 640 |
| Commercial | 360 | 272 | 307 | 278 | 341 | 276 |
| Media | 143 | 98 | 99 | 127 | 146 | 139 |
| Research | 47 | 50 | 74 | 106 | 102 | 124 |
| Charity | 25 | 29 | 42 | 35 | 26 | 38 |
| Authority | 13 | 11 | 6 | 17 | 21 | 9 |
| MP/Parliament | 11 | 12 | 8 | 18 | 13 | 9 |
Subject access requests
In total, we have received 158 subject access requests over this period. This is an increase of 14% on last year. 88% of these were for the People Directorate.
Of the People Directorate requests:
- 26% were for children's services - this is a drop from 46% in 2023 to 2024 (children's services are also partially involved in a further 15% of combined requests)
- 13% of requests are for adult services
- 10% are specifically related to SEN requests
- 7% are cross-organisational, which is slightly down from 10% last year
Total number of SARs
| Month | Communities | Multiple Directorates | People | Place | Resources |
|---|---|---|---|---|---|
| January | 0 | 1 | 13 | 0 | 1 |
| February | 0 | 0 | 17 | 0 | 0 |
| March | 0 | 1 | 15 | 1 | 0 |
| April | 0 | 2 | 6 | 0 | 0 |
| May | 0 | 1 | 4 | 0 | 0 |
| June | 1 | 2 | 9 | 0 | 0 |
| July | 0 | 0 | 12 | 1 | 1 |
| August | 0 | 0 | 10 | 3 | 0 |
| September | 0 | 1 | 13 | 0 | 0 |
| October | 1 | 0 | 9 | 0 | 0 |
| November | 0 | 1 | 14 | 0 | 2 |
| December | 0 | 0 | 9 | 0 | 0 |
Open request status
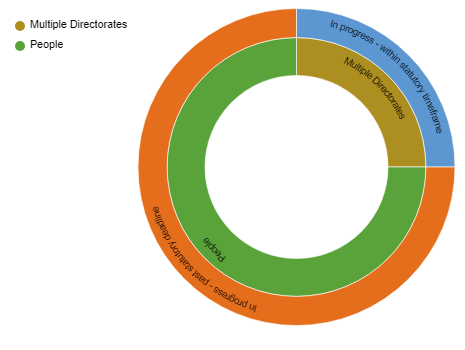
The breakdown of SARs requests in progress shows:
- past salutatory deadline (People directorate) - 75%
- within statutory time frame (multiple directorates) - 25%
Breakdown by type of incident
35% of completed SARs needed some or full redaction of third-party information. This is down from last year's 66%.
This is likely linked to better recording in our closure process. It also reflects the teams' efforts to provide the information data subjects need.
Where SARs are recorded as being late, it is because they have exceeded the statutory time limit or agreed extension, which can be up to 2 extra months.
Completing requests within statutory timeframe
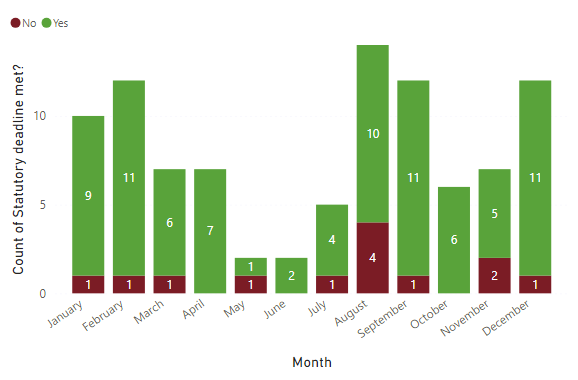
| Month | Number of requests completed on time | Number of requests completed late |
|---|---|---|
| January | 9 | 1 |
| February | 11 | 1 |
| March | 6 | 1 |
| April | 7 | 0 |
| May | 1 | 1 |
| June | 2 | 0 |
| July | 4 | 1 |
| August | 10 | 4 |
| September | 11 | 1 |
| October | 6 | 0 |
| November | 5 | 2 |
| December | 11 | 1 |
Average response time (in days) for requests completed in a given month
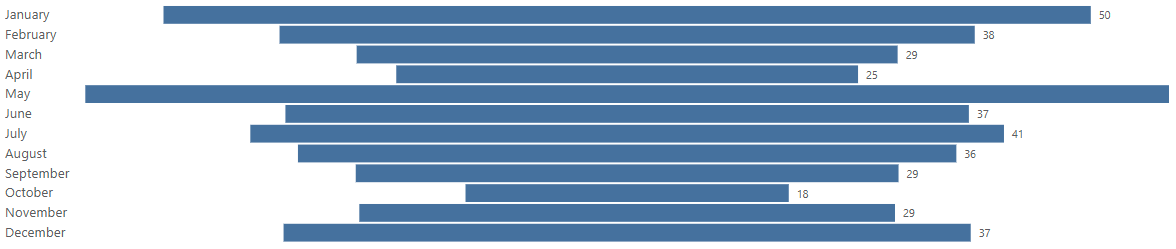
| Month | Response time (in days) |
|---|---|
| January | 50 |
| February | 38 |
| March | 29 |
| April | 25 |
| May | 59 |
| June | 53 |
| July | 41 |
| August | 36 |
| September | 29 |
| October | 18 |
| November | 29 |
| December | 37 |
Data protection complaints and third party requests
The number of complaints where the complainant asks for it to be treated as a data protection issue is relatively low. These can come from members of the public or from the ICO.
Those received from the ICO have a strict 14-day response timeframe. These are often complex and time-consuming. They tend to follow our initial responses to a SAR or data breach complaint from individuals.
The data protection officer (DPO) works closely with other complaints managers as they are often interacting with the same individuals.
Bringing the data protection complaints into the corporate complaints system is on the backlog of work for the digital team.
Total data protection complaints received
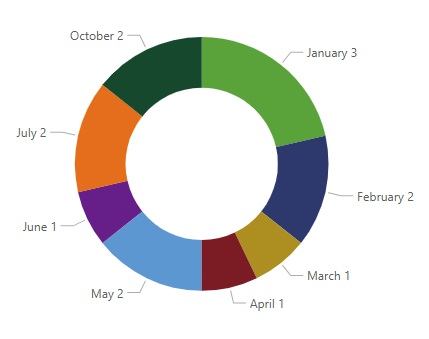
Complaints received by month show:
- January - 3
- February - 2
- March - 1
- April - 1
- May - 2
- June - 1
- July - 2
- October - 2
Count of complaint status
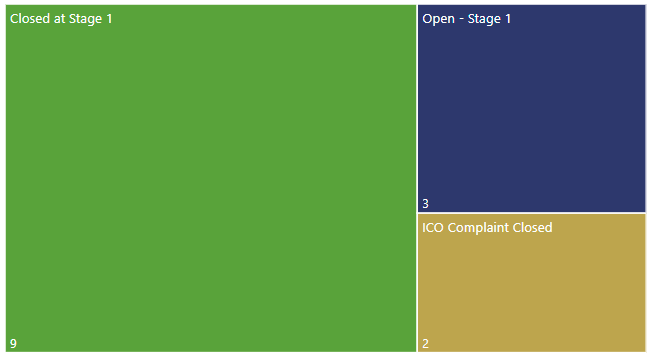
Count of complaint status shows:
- closed at stage 1 - 9
- open at stage 2 - 3
- ICO complaint closed - 2
Key issues
We respond to 54% of third-party requests in full. For the remaining 46%, we find that we either:
- do not hold the data
- have not received the correct information from data subjects or their representatives
- have not had a response to further clarification requests
75% (143) of recorded third-party requests now come directly through the DPO mailbox.
Before, most requests related to Thames Valley Police (TVP) or the Department for Work and Pensions (DWP). However this year, 68% of all requests have been part of legal investigations.
Third party by status
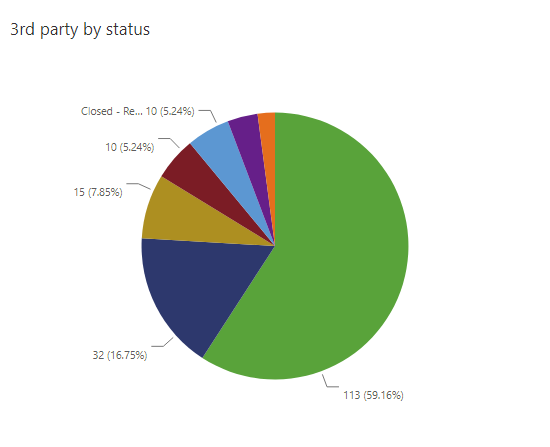
The third party by status chart shows:
- closed (request fulfilled) - 113
- closed (request declined due to no information) - 32
- closed (request declined) - 15
- closed (further information required but not received) - 10
- closed (request cancelled) - 10
- in progress - 7
- closed (other) - 4
Third party requests by month
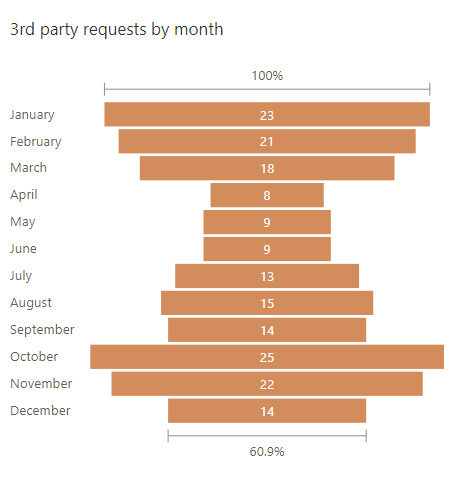
The third party requests by month shows:
- January - 23
- February - 21
- March - 18
- April - 8
- May - 9
- June - 9
- July - 13
- August - 15
- September - 14
- October - 25
- November - 22
- December - 44
Third party requests by type
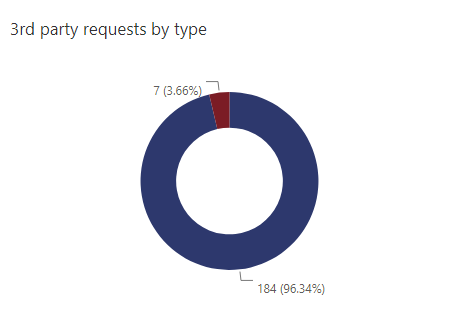
The third party requests by type chart shows:
- third party request for information - 184
- individual rights request - 7
More information
You can find out more about data protection and your rights from the ICO.