Production and transportation of purchased goods and services
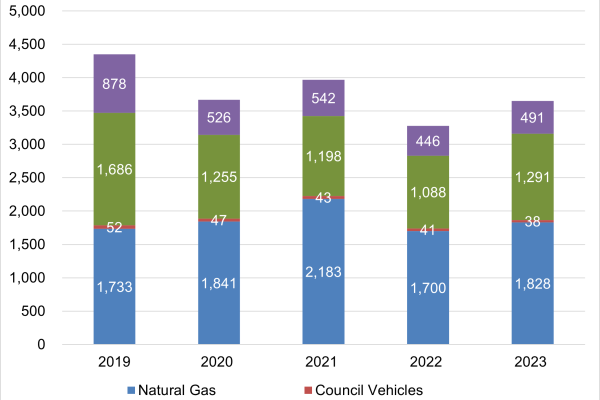
Bracknell Forest Council is responsible for emissions from a range of sources. The graph below shows how emissions from energy use in its buildings and fuel use in its vehicles (referred to as scope 1 and 2 emissions) break down and the changes over time.
Because different greenhouse gases have different lifespans in the atmosphere and different impacts on warming, it is standard practice to summarise emissions of different gases by comparing their impact to that of carbon dioxide – hence the use of tonnes of carbon dioxide equivalent (tCO2e) when measuring emissions.

In addition to this, the council is indirectly responsible for causing emissions elsewhere, from sources it does not control directly. These are known as scope 3 emissions. These are more difficult to measure, but major sources of scope 3 emissions are likely to include the following:
Emissions from assets leased out
Delivery of outsourced services
Staff travel, commuting and home working
Investments
Disposal of the organisation's waste
(What are Scope 3 emissions and why do they matter?, The Carbon Trust)