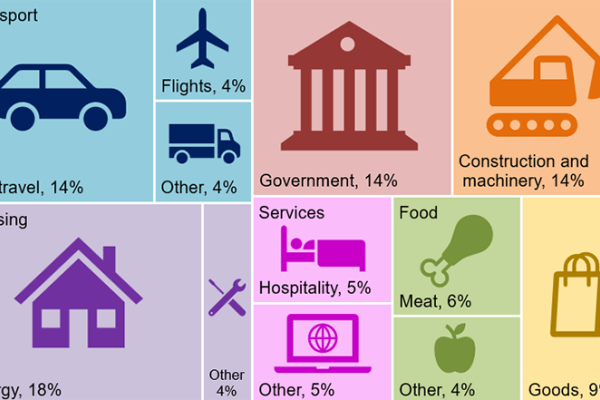
In 2021, Bracknell Forest residents were responsible for a total of 1,354 ktCO2e of emissions . There is a large overlap with borough emissions, for example, in domestic heating and personal transport.
However, this footprint covers additional categories, including emissions from:
- the goods and services residents buy
- investment (such as construction) in the borough
- the delivery of government services which residents depend on
Unlike territorial emissions it does not include emissions in the borough not connected with residents (such as those from local businesses).
It is important to track these emissions as well as territorial emissions because the activities of residents cause emissions to take place elsewhere. This can be outside Bracknell Forest or even the UK, so focusing solely on territorial emissions would miss a large part of Bracknell Forest’s impacts as a place. The graph below shows how these emissions break down:

Data taken from the Local Authority Consumption Accounts (LACA), Owen, 2024. 2021 is the most recent year for which this data is available.