Economic performance
Number of foreign owned businesses with 250+ employees
26
Target of 28 by 2028
This update covers quarter 3 (October to December) for 2025 to 2026.
The third quarter for the second year of the economic strategy has seen the continued development of the Bracknell Forest Economic Partnership and progress towards the actions identified in the partnership’s action plan. The partnership has focussed on 3 priority areas that align with the economic strategy.
Engagement with The University of Reading, The University of Surrey and Royal Holloway, University College London (RHUL) is taking place. The aim being to explore and strengthen areas of potential collaboration between the council, businesses and higher education establishments.
Draft website content to promote Bracknell Forest as an excellent business location has been developed. We have sought feedback from the Bracknell Forest Economic Partnership and local businesses to produce a coordinated prospectus. This will be published on the Bracknell Forest Council business web pages.
In partnership with the council, The Berkshire Growth Hub continues to offer comprehensive business support to start-ups and existing businesses in the borough through one-to-one support and free masterclasses, such as a sales and AI masterclasses.
The Berkshire Growth Hub is delivering a retail support focussed pilot to 2 retail areas in the borough, Crowthorne and Sandhurst. If the pilot is successful, and subject to capacity, it will be expanded in the future.
The Healthy Workplace Alliance membership continues to grow. The website provides an extensive range of resources to support businesses, with new content added regularly. The next quarterly meeting is due to be held spring 2026.
Under each of the 4 themes in the Economic Strategy, there is 1 key metric that shows the current position of Bracknell Forest. These will be kept under review by the council’s economic development team and the Bracknell Forest Economic Partnership. Principal indicators are set out below.
Number of foreign owned businesses with 250+ employees
26
Target of 28 by 2028
Companies in Bracknell Forest with a turnover of £1 million to £5 million
8.08%
(September 2025)
Previously reported at 7.91% (September 2024)
Gross weekly pay full time workers
£862.40
(2025)
Previously reported at £778.70
(2024)
5G availability
97%
(July 2025)
Previously reported at 96% (January 2025)
The quarter 3 report is an update on the base position set in reports for the first year (2024 to 2025) and quarter 2 (2025 to 2026). For quarter 3, the indicators and performance measures continue to show a broadly positive outlook.
The following charts show the current status of the 24 key metrics under the priority themes identified in the Bracknell Forest Economic Strategy 2024-2034:
They provide an overview of the current position versus target as a red, amber or green (RAG) status, plus the direction of travel of latest data against previous results.
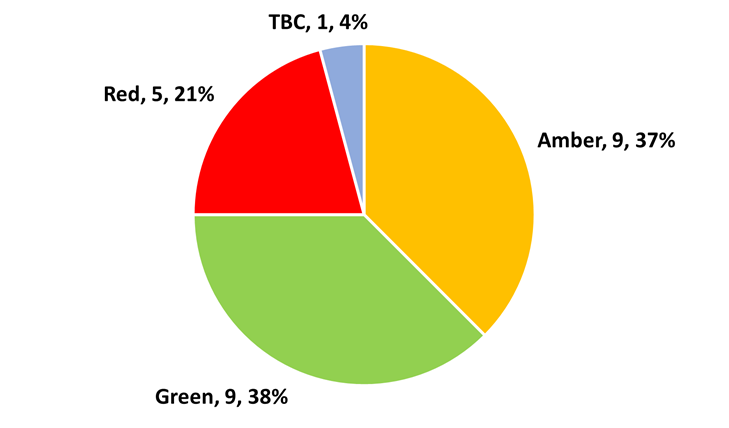
Economic Strategy action plan indicators: RAG status summary at quarter 3 2025 to 2026.
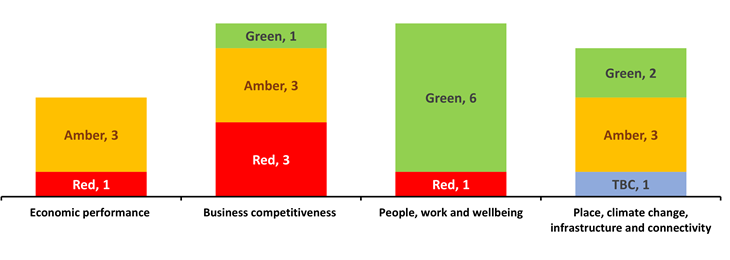
Economic Strategy action plan indicators: RAG status by theme at quarter 3 2025 to 2026.
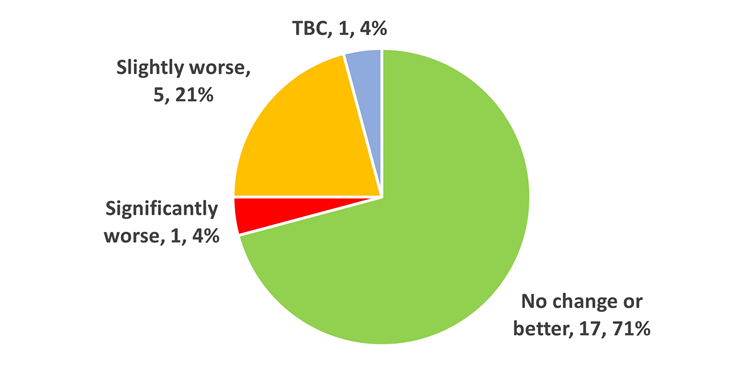
Economic Strategy action plan indicators: performance trends summary at quarter 3 2025 to 2026.
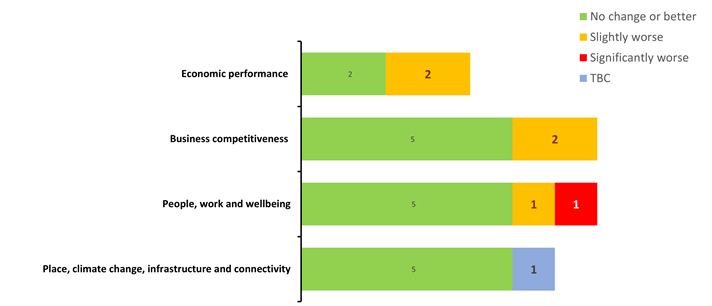
Economic Strategy action plan indicators: performance trend by theme at quarter 3 2025 to 2026.
The chart below summarises the performance and trend for all 24 metrics in the Economic Strategy action plan, further detail is provided in the appendix.
| Attachment | Size |
|---|---|
| 289 KB |
If the current performance status is ‘red,’ it is over 10% off target or forecast, and the data has changed since the quarter 1 report (2025 to 2026). See the commentary below.
-3.11% compared to -3.75% reported in the previous quarter.
While this metric continues to report red, there is a slight improvement on the previous figure reported.
We are performing better than those in the functional economic area (FEA), as shown in the chart and table below.
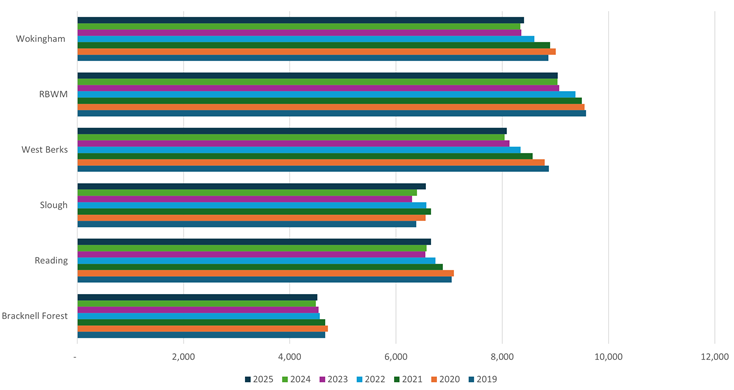
| Council | 2019 | 2020 | 2021 | 2022 | 2023 | 2024 | 2025 |
|---|---|---|---|---|---|---|---|
| Bracknell Forest | 4,665 | 4,720 | 4,665 | 4,565 | 4,540 | 4,490 | 4,520 |
| Reading | 7,045 | 7,090 | 6,880 | 6,740 | 6,550 | 6,575 | 6,660 |
| Slough | 6,380 | 6,555 | 6,660 | 6,570 | 6,300 | 6,395 | 6,560 |
| West Berkshire | 8,875 | 8,800 | 8,570 | 8,345 | 8,135 | 8,045 | 8,085 |
| Windsor and Maidenhead | 9,575 | 9,550 | 9,495 | 9,375 | 9,070 | 9,040 | 9,045 |
| Wokingham | 8,865 | 9,005 | 8,900 | 8,605 | 8,360 | 8,340 | 8,410 |
Percentage change since 2019
| Bracknell Forest | Reading | Slough | West Berkshire | Windsor and Maidenhead | Wokingham |
|---|---|---|---|---|---|
| -3.11% | -5.46% | 2.82% | -8.90% | -5.54% | -5.13% |
47.1% in 2024 previously reported at 49% in 2023.
The number of business births per 10,000 of working age population has declined from the previous result. The chart below shows this in comparison to the functional economic area.
The Berkshire Growth Hub will continue to offer comprehensive business support for both start-ups and existing businesses in Bracknell Forest.
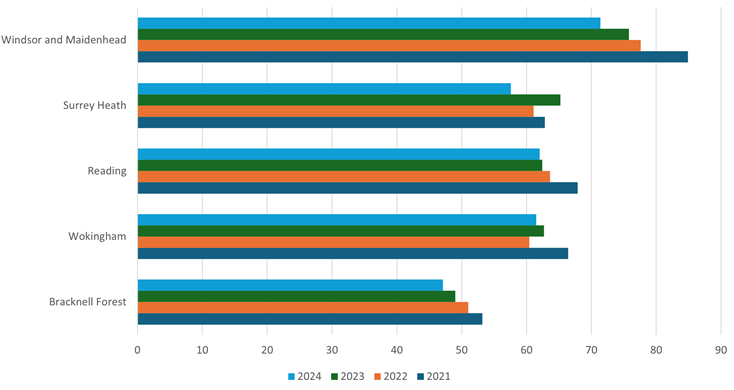
| Year | Bracknell Forest | Wokingham | Reading | Surrey Heath | Windsor and Maidenhead |
|---|---|---|---|---|---|
| 2024 | 47.1 | 61.5 | 62 | 57.6 | 71.4 |
| 2023 | 49.0 | 62.7 | 62.4 | 65.2 | 75.8 |
| 2022 | 51.0 | 60.4 | 63.6 | 61.1 | 77.6 |
| 2021 | 53.2 | 66.4 | 67.9 | 62.8 | 84.9 |
Educational attainment in Bracknell Forest is moving in a very positive direction as seen in the chart below.
The proportion of residents achieving RQF3 has risen from 45.5% to 51.4%, and those reaching the higher RQF4 level have increased from 68.8% to 72.9%.
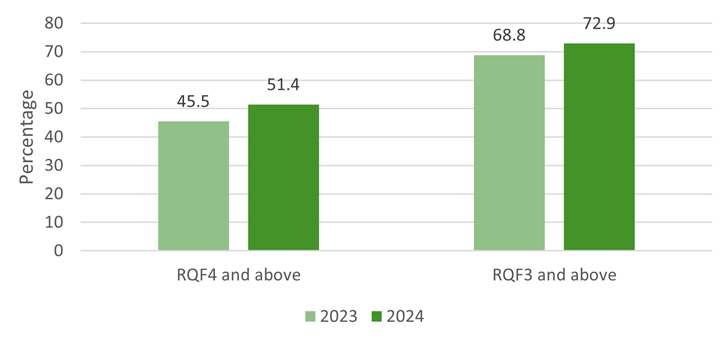
| Qualifications | 2023 | 2024 |
|---|---|---|
| RQF4 and above | 45.5 | 51.4 |
| RQF3 and above | 68.8 | 72.9 |
There has been a positive improvement in the proportion of residents working in the lowest 3 occupational groups, falling from 17.5% (July 2024 to June 2025) to 16.3% (October 2024 to September 2025).
To build on this progress, we are pleased to confirm that the Bracknell Forest Youth Employment Hub launched in January 2026. This 12‑month pilot project aims to support 18 to 24‑year‑olds in receipt of Universal Credit into sustained employment.
The Connect to Work programme also launched in January. This voluntary, DWP‑funded supported employment programme is delivered across Berkshire by Palladium, together with Breakthrough in Bracknell. It offers up to 12 months of personalised support to individuals who are unemployed or at risk of losing their job.
The programme supports:
This programme will run for 5 years. Visit Connect to work for more information.
We have also seen the gap between residents’ wages and workplace‑based wages narrow, indicating that Bracknell Forest residents are increasingly accessing the same quality of jobs as those commuting into the area. The chart and table below show the latest available data.
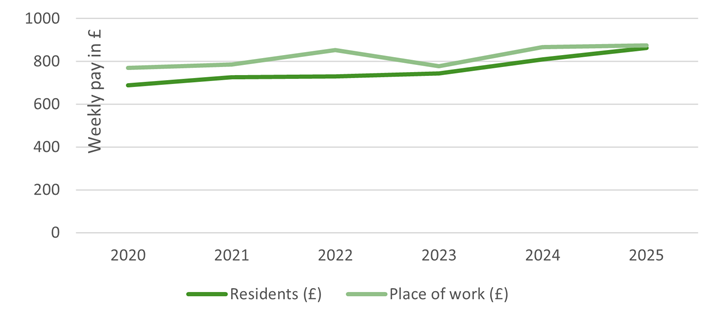
| Year | Residents | Place of work |
|---|---|---|
| 2019 | £682.10 | £712.40 |
| 2020 | £687.80 | £770.80 |
| 2021 | £726.50 | £786.30 |
| 2022 | £730.00 | £852.40 |
| 2023 | £743.80 | £778.70 |
| 2024 | £809.60 | £867.20 |
| 2025 | £862.40 | £874.60 |