Actions status
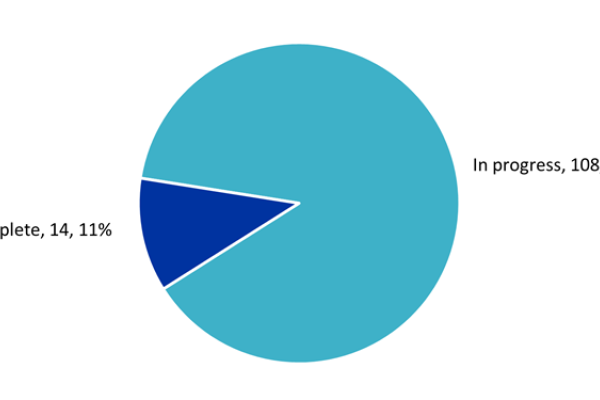
At the end of quarter 2 (July to September 2025), there were 122 actions to be reported of which:
- 14 were complete (11%)
- 108 were in progress (89%)
All actions by stage
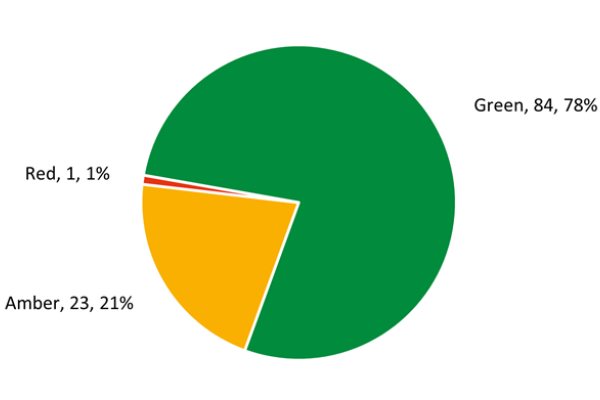
Of the 108 actions in progress:
- 84 were reported as ‘green’ on track (78%)
- 23 were reported as ‘amber’ slightly off track, with no concern (21%)
- 1 were reported as ‘red’ at risk (1%)
All actions by RAG status in progress
Performance and contextual indicators
Section 3 of this report provides further detail on the reasons for the status and information on the performance indicators and contextual indicators for each of the priorities in the Council Plan.
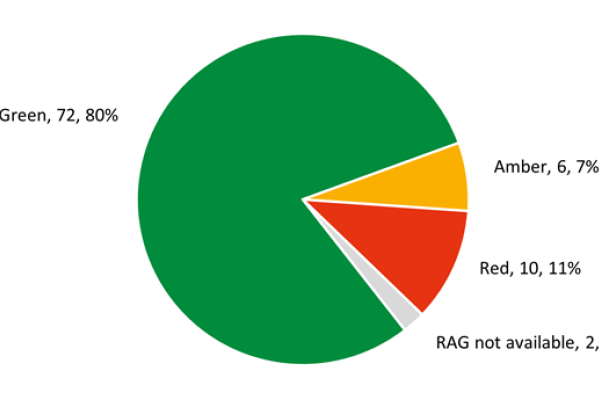
At the end of quarter 2 (July to September 2025), there were 90 indicators presented, 89 reported quarterly and one reported annually, due at quarter 2.
53 indicators are performance indicators1, measured against a target as the output/outcome is within the council’s control. 37 indicators are contextual indicators2, measured against a forecast as the outcome is outside of the council’s control.
Of 90 performance indicators reported at quarter 2:
- 72 were reported ‘green’, on track against forecast (80%)
- 6 were reported ‘amber’ slightly off forecast (7%)
- 10 were reported ‘red’ significantly off forecast (11%)
- 2 were reported as ‘RAG not available’ as data was not available at the time of the report - comments are provided for explanation
- 1
Performance indicator – result is measured against a target. It is usually related directly to a council service and an indicator of service effectiveness, efficiency and/or success.
- 2
Contextual indicator – result is measured against a forecast. It is usually outcome focussed and often not wholly within the council’s control. Contextual indicators are included as they may impact service delivery, demand and the achievement of wider council goals.
All indicators by RAG status
Actions by priority and RAG status in progress
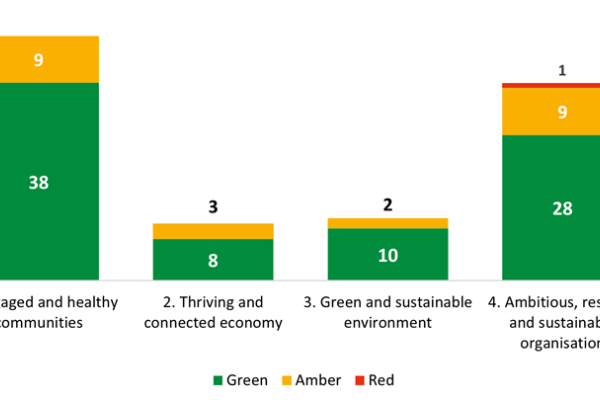
| Priority | Green | Amber | Red | Total |
|---|---|---|---|---|
| Engaged and healthy communities | 81% | 19% | 0% | 100% |
| Thriving and connected economy | 73% | 27% | 0% | 100% |
| Green and sustainable environment | 83% | 17% | 0% | 100% |
| Ambitious, resilient and sustainable organisation | 74% | 24% | 3% | 100% |
Totals may not add up to 100% due to rounding.
Indicators by priority and RAG status
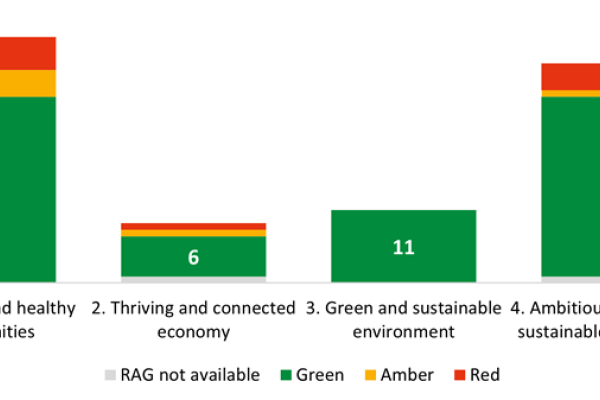
| Priority | Green | Amber | Red | RAG not available | Total |
|---|---|---|---|---|---|
| Engaged and healthy communities | 76% | 11% | 14% | 0% | 100% |
| Thriving and connected economy | 67% | 11% | 11% | 11% | 100% |
| Green and sustainable environment | 100% | 0% | 0% | 0% | 100% |
| Ambitious, resilient and sustainable organisation | 82% | 3% | 12% | 3% | 100% |
Totals may not add up to 100% due to rounding.